“It was the best of times. It was the worst of times.” This famous line opens A Tale of Two Cities, a novel that contrasts London and Paris before and after the French Revolution. How does Charles Dickens relate to the 21st century, methods for collecting data in the United States, or Sustainable Development Goals? Because of that central thesis: that prosperity and poverty, health and sickness, and stability and insecurity can co-exist. Often, they can co-exist closer together than we think.
The Sustainable Development Goals are a global blueprint for a just, sustainable, and equal future. But meeting these goals in the United States on a national level is not enough. The true goal is spurring meaningful action in states, counties, cities, and communities within the US. To do this, we must adapt these goals in terms of relevant geographic units of analysis (states, metro areas, or counties), population groups (racial and ethnic groups, women and men, foreign- and US-born residents), and available well-being indicators. In other words, we must disaggregate our data to understand how everyone is doing.
Let’s start with something smaller: a tale of two city council districts. The 11th City Council District of Los Angeles is home to Los Angeles’ famous Venice Muscle Beach, as well as upscale neighborhoods such as Pacific Palisades and Brentwood. Their predominantly white residents enjoy a poverty rate below seven percent and some of California’s highest scores on Measure of America's American Human Development Index (this index combines indicators on health, education, and income - three basic building blocks of a good life - and expresses the result on a zero-to-ten scale). The neighborhood has trendy restaurants, beautiful landscaping, and 28 parks, which amounts to 3 acres of parkland for every 1,000 residents.
Los Angeles’ 10th City Council District is about 10 miles east. The neighborhoods of Jefferson Park, Arlington Heights, and West Adams are dotted by gas stations and corner stores and dominated by the Santa Monica freeway at their center, while boasting a 20 percent poverty rate and some of the lowest human development scores. The majority Latino and black population has 18 parks but only 0.35 acres of parkland for every 1,000 residents.

These parks represent disparate resources in communities right next to each other, yet they also represent startlingly different outcomes and SDG markers. The disparity in each residents’ ability to exercise outdoors in their district, either in the parks or by walking on their sidewalks and streets, is reflected in health and longevity outcomes. According to the LA Department of Public Health and data published in Measure of America’s A Portrait of Los Angeles County, a baby born in City Council District 11 has a longer life expectancy than a baby in District 10 by over four years. In addition, District 10 has a hospitalization rate for symptoms related to diabetes (a preventable chronic disease fueled by lack of access to physical activity and healthy diets) three times higher than District 11.
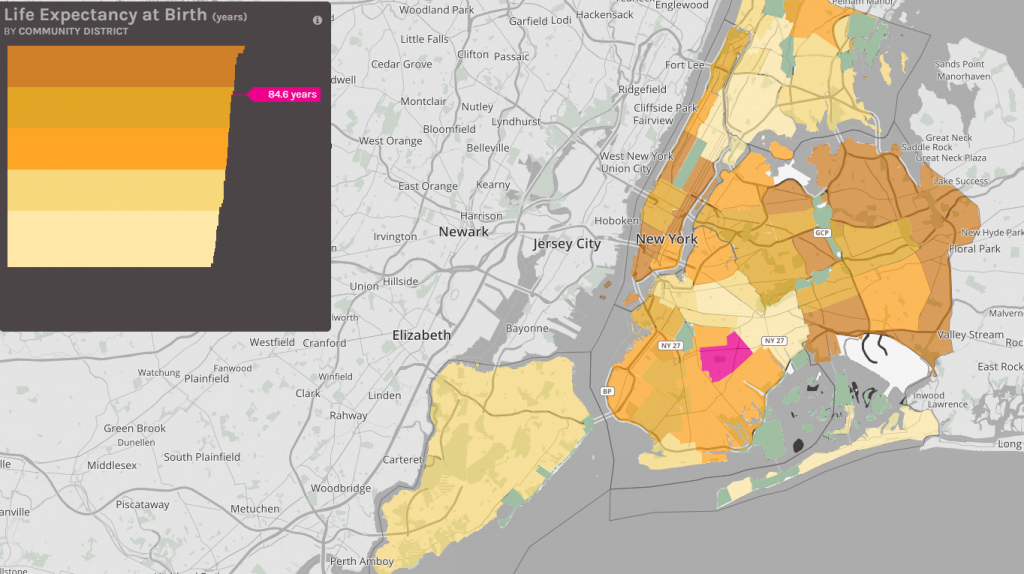
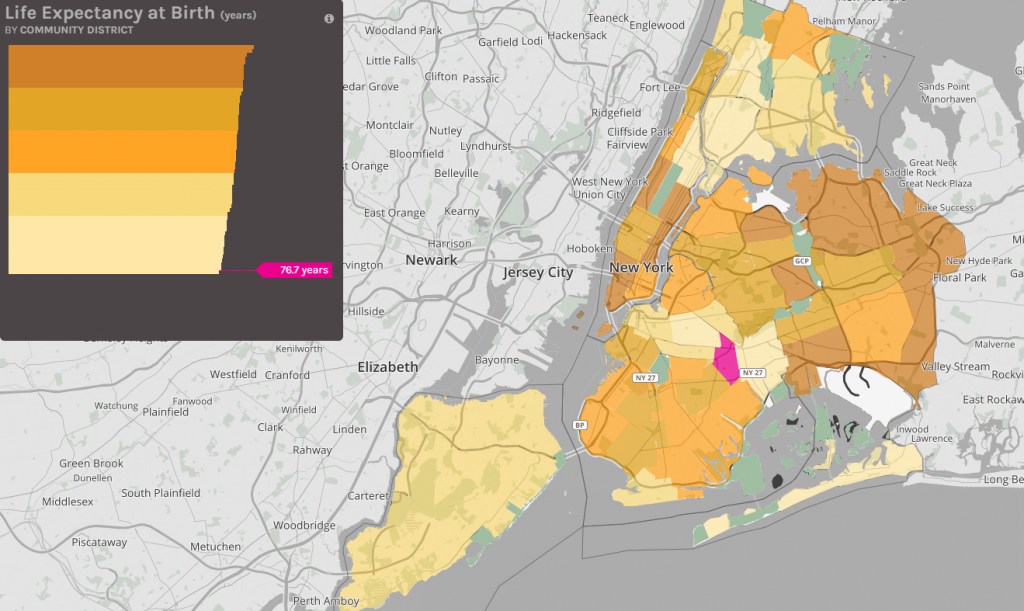
Let’s look at one more example on the opposite coast, a tale of two community districts in New York City. Two neighborhoods in Brooklyn are just across the street from one another, yet eight years apart in terms of a critical SDG indicator: life expectancy at birth. East Flatbush, Farragut, and Rugby has a life expectancy rate of 84.6 years, compared to Brownsville and Ocean Hill, where residents can expect to live 76.7 years. Residents in the latter neighborhood have the highest rate of premature death in the city, the highest rates of death due to renal diseases, cancer, and diabetes, and among the highest rates of drug-related, assault, and psychiatric hospitalizations in NYC. In East Flatbush, the rate of premature deaths hovers around the city’s average, and the respiratory disease and substance abuse death rates are among the lowest.


An on-the-ground look reveals the notable differences in these neighboring districts. Brownsville houses many New York City Housing Authority (NYCHA) public housing developments and has the second highest incarceration rate in the city. Documented poor housing conditions in NYCHA have raised concerns about tenant health. Further, contact with the prison system has been linked to poor health, possibly due to the stigma of having a criminal record. East Flatbush, on the other hand, benefits from the higher life expectancy of its concentrated foreign-born population (over half) relative to US-born residents.

We must do our best to meet the SDGs everywhere and for everyone, not just in aggregate at the national level. Data tools like Mapping America, which features a curated set of SDG indicators, can help us track our progress and prioritize action. After all, the foundational principle of these goals and of the 2030 Agenda for Sustainable Development is to leave no one behind. Doing so means we have to pay attention to historically disadvantaged groups, particularly when high aggregate scores can easily mask severe deprivation in specific places and among specific groups. Disaggregated data is the key to digging past the bigger numbers, understanding the differences between communities and demographic groups, discovering more tales of two, and taking action to close well-being gaps.
